पोस्ट्स

2021 पासूनच्या पोेस्ट दाखवत आहे

National Family Health Survey-5 the state level data: Let’s play with some indices: Part 1
इमेज
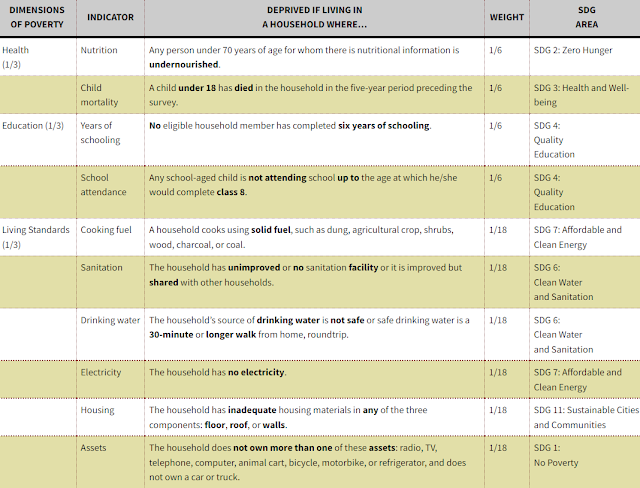
NFHS-5 data at the state level is now available for all states. Taking various ideas and indices altogether, let’s talk in the more easy way, who progressed and who didn’t. Whenever one talks about development, the first index that comes to mind is Human Development Index. The human development index has three main indicators: health (Life expectancy index), education (expected years of schooling and mean years of schooling), and income (per capita gross national income (PPP)). This covers the main important pillars. While the Human development index measures development, there are other indices like the multi-dimensional poverty index which measures poverty. Global Multidimensional Poverty Index, given by Oxford Poverty and Human Development Initiative, has 10 indicators. Table no.1 gives more details. Table no.1 Source: https://ophi.org.uk/multidimensional-poverty-index/   While Human Development Index can easily be constructed at the state level, the multidimensional poverty ind

India: Populous Country or Aging Society?

इमेज
The recent discussion about population control sparked by the ruling party and the UP government’s bill is a bit perplexing because the government's academic stance differs. The economic survey 2018-19 (ESI 2018-19) raises concern over rapidly declining population growth as well as falling total fertility rate. It also suggests that few states will begin to transition to an aging society. There are two important questions (ignoring the religious argument. According to NFHS-4 (2015-16) and NFHS-5 (2019-20) (National Family Health Survey), almost all religions are witnessing the decline in fertility rate). 1) Is the population actually growing? 2) Population and (vs) Development: Population or Human Capital? 1) Is the population actually growing? India's annual population growth rate is already decreasing (Fig. 1). For the majority of states, population growth is less than one. It is highest in Bihar, with a population growth rate of less than 2 (Fig. 2). Figure 1 : A

NFHS-5 (2019-2020) some interesting points

इमेज
NFHS-5 (2019-2020) state reports are available. In this post, we will discuss and compare three states: Maharashtra, Gujarat, and West Bengal. I will try to discuss some interesting points 1) Land ownership:  Table no. 1 (NFHS-5) Table no. 2 (NFHS-4) 3.8 percentage reported that they have Non irrigated land for Gujarat, 17.5 for Maharashtra, and 2.8 for West Bengal. That is very problematic for Maharashtra. This non-irrigated land was around 19% according to a previous NFHS survey (2015-16). The Maharashtra state failed to convert this land either into irrigated land or into non-agricultural land for non-agricultural purposes as both non-agricultural land and irrigated land share a small proportion compared to other states. Interestingly Maharashtra government in 2016 has launched the Jalyukt Shivar Abhiyan to make Maharashtra drought-free. That doesn't add up here. The percentage of non-irrigated land for Maharashtra is still high. The state has to take efforts to deal with non-ir

Future of Middle Class

Pew Research Centre recently published their reports which suggest that due to the pandemic global middle class will face a crisis and will become “Poor”. For India, it is suggested that the Pandemic pushes 32 million Indians out of the middle class. I have two main objections related to the reports/articles.  The first is related to the methodology. The findings are based on the extrapolation of previous surveys (pre-pandemic surveys) based on regional income distributions from the World Bank’s PovcalNet database. Therefore, the findings are not based on household surveys but on extrapolation. And that would obviously lead to the decline in income of every income category (poor, low income, middle, high-income category) with the same rate (as the overall size is contracted) which Pew Research article also assumes in methodology. This assumption misses one important point: the association between inequality, poverty, and growth is dynamic and also get affected by the pandemic. Assuming

Economic Survey of India: a big mess

इमेज
Economic Survey of India is providing incomplete arguments. There are serious issues in presenting the data. Since data used in Economics Survey (NFHS-5) is not yet publicly available, we will try to understand where the economic survey’s argument is incomplete and why I am skeptical about the data and methodology used. (I am not going to discuss the chapters which were highlighted in the previous survey and ignored by given survey like the discussion of five trillion economy, doubling farmers income, etc. I will discuss it in my next post.) First, predicted growth rate for 2021. IMF has predicted 11.5% where Survey also predicted that the growth rate will be around 11%. Why? On what basis, this double-digit figure is predicted.  Let’s discuss the IMF’s prediction.  IMF has predicted Y-Y growth rate is 11.5% where Q4 over Q4 is 1.69% in January 2021 World Outlook. This prediction was at 8.8% (for Y-Y growth rate) in October 2020. IMF has not given any strong reason for increasing the p