पोस्ट्स

2017 पासूनच्या पोेस्ट दाखवत आहे

BJP is losing the GUJARAT...

इमेज
There is tremendous reduction in the power of BJP in Gujarat. One can easily say that by just observing the seats won by BJP. But I am going to use some concentration index to show that. In market, Herfindahl-Hirschman Index (HHI) is used to measure the monopoly power. The range of HHI is between 0 and 1. If HHI is 1 then there is monopoly i.e. one firm has absolute power in given market and if HHI is zero then it means no one has control over the market. HHI is calculated by adding the square of market shares of firms. Now I am going to use this HHI index in political economy to measure the concentration of power. After that I will use Effective Number of Political Parties which is proposed by Laakso, M., & Taagepera, R. (1979) to measure the degree of coalition. (Data source – Election Commission of India)  Now let’s see the HHI and ENP.  (Index has been calculated) Let me explain the trends. Here HHI is reduced from 0.48 to 0.29 in last 15 years. That is 5
knock knock.. Is crisis at door?

इमेज
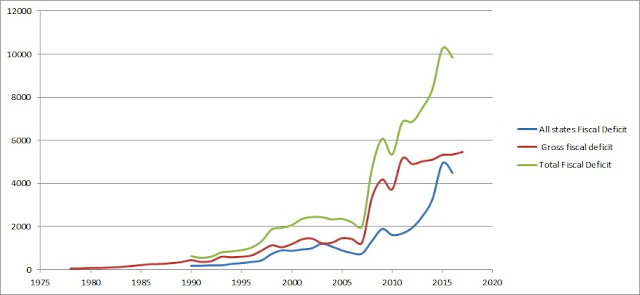
Rather go to bed without dinner than to rise in debt. - Benjamin Franklin   We are going to bed without dinner but still debt is rising. Our outstanding liability is around 67% of total GDP. Fiscal deficit at the end of August was around 96% of the budget estimate for 2017-18. Then one important question arises – ‘Are we moving towards 1991?’ Let’s see..  (Source - Data from Reserve Bank of India is used for calculation) Fiscal deficit is obviously very high. For this time, I am taking absolute figure (not in percentage). Both states and central fiscal deficit is very higher than 1990s Fiscal deficit. Total outstanding liability is rapidly increasing and very high compare to 1991. Revenue deficit is also higher than 1991 in absolute terms.  (Source - Data from Reserve Bank of India is used for calculation)  So does it mean we are very close to crisis? Let’s see another side of picture.. Foreign reserves are increasing and very high compare t

Indian states.. life in debt…

इमेज
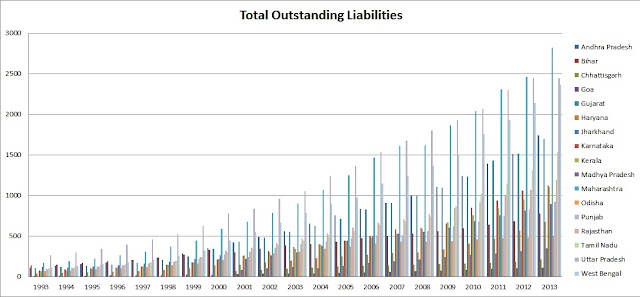
Our system - of debt-fueled economic growth, of ineffective democracy, of overloading planet Earth - is eating itself alive - Paul Gilding. Forget about debt-fueled ECONOMIC GROWTH, few Indian states have only growth in their OUTSTANDING LIABILITIES. We talk too much about outstanding liabilities and Fiscal Deficit of Central government. But we can’t ignore the financial health of Indian states. Andhra Pradesh is continuously borrowing from markets. West Bengal is new competitor for Andhra Pradesh. One might say that revenue deficit or fiscal deficit is under control or government is taking serious steps to control their deficits. But these deficit can't be financed by borrowing. If it is a case then we should start thinking about outstanding liabilities of Indian states. (Source -  Reserve Bank of India - Handbook of Statistics on Indian States.  To make it simple, data selection is restricted to 2013 as Telangana state is created in 2014 and Andhra Pradesh is very im

Maratha Kranti Morcha.. What does it show and what does it mean?

इमेज
Maratha community is protesting since last few years. One thing we should appreciate that the protests were peaceful. But I disagree with the concept of this protest. My relatives and friends who are part of this silent protest march might not like this opinion but this is what I think.  In democracy everyone has right to protest. I am not against any protest march. Everyone should express his/her disagreements. People from Maratha community are also suffering from problems like poverty, unemployment etc. These problems come regardless your caste. (But what about social discrimination? In Maharashtra, (so called progressive state) we have seen honor killings. Right now I don’t want to get into this and I won’t talk about caste discrimination). But certain things are difficult to understand. One thing which I observe is that the name of Chhatrapati Shivaji Maharaj has been used intensively. Protestors were saying that Chhatrapati Shivaji Maharaj was their ancestral. It shows that

Credit flow in agriculture – A puzzle..

इमेज
Last year, we had a good discussion over agriculture and its future. I always thought that the credit flow in Indian agricultural market is not enough. Agricultural sector in India is continuously facing insufficient credit delivery (Godara, R. L., Singh, P., & Singla, S. (2014).). Authors also point out that the Indian banking system is not willing to give any king of credit to farmers especially small and marginal. Therefore government must encourage the credit delivery as credit is very important. In India, proper agricultural credit supply is badly required for agricultural production (Das, A., Senapati, M., & John, J. (2009)). By using Panel Data Analysis, authors show that there is an immediate, significant and positive impact of direct agricultural credit on agricultural output. Indirect agricultural credit has also positive and significant impact on agricultural output but the effect is not immediate. Credit has also positive impact on use of inputs in agriculture (Na

Too much investment but where is capital?

इमेज
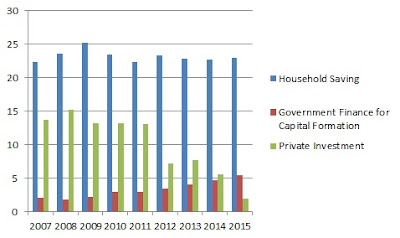
Long-term unemployment can make any worker progressively less employable even after the economy strengthens - Janet Yellen.  Economy is growing rapidly, FDI is surging but where is Capital? Where are jobs and how can we create jobs without capital?? With business friendly policies, government is doing everything to have large FDI. Okay, let’s discuss some papers related to FDI and Economic growth.  As far as capital is concerned, FDI is very important which is connected with job creation (Chowdhury, A., & Mavrotas, G. (2005). FDI and growth: a causal relationship (No. 2005/25). Research Paper, UNU-WIDER, United Nations University (UNU)). With two way link between FDI and GDP, India is becoming a favored destination for FDI. FDI is increasing with increasing GDP. GDP is not increased by FDI but this causality runs more from GDP to FDI (Chakraborty, C., & Basu, P. (2002). Foreign direct investment and growth in India: A cointegration approach. Applied economics, 34(9),

GST, GST and GST

“Only two things are certain in this life – death and taxes.” – American author Mark Twain I have written this article before 20-30 days. But for some reason I couldn’t post this. So what is GST? I think you must hear something about GST. So I am not going to repeat everything. I am explaining some issues. Implementation is not my concern as it is routine now but there are some INBUILT problems. Before that I would like to discussion some historical aspects of TAX REFORM in INDIA. You might know that India is quasi federal state. So there is a division of tax powers between central and state governments. State taxes are – Agricultural personal income, sales taxes, excise on alcoholic beverages, state transport taxes, some property taxes, electricity taxes etc. Centre taxes are – Non-agricultural personal income and wealth taxes, corporate profit taxes, customs and excise duties (now manufacturers’ VAT) of manufactured products. Some tax reforms are – 1)      The Income Ta

Farm loan waiver, why? Another crisis for Maharashtra?

इमेज
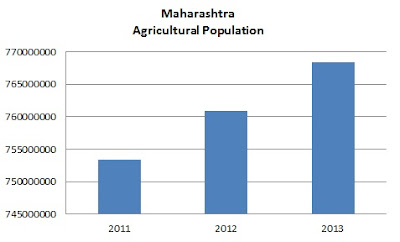
Everywhere, everyone is debating and explaining his/her opinion on Maharashtra farm loan waiver. I am just trying to explain it with some data and evidence. Before discussing the FUTURE OF MAHARASHTRA ECONOMY, I would like to explain an importance of credit in agriculture sector. Attempts to strengthen Indian agriculture must address not only farm production (farmers) but also processing, marketing, trade, and distribution. We must link farmers to markets. In this endeavor, marketing and rural credit systems are extremely important. (Acharya, S. S. (2006). Agricultural marketing and rural credit for strengthening Indian agriculture.). The agriculture sector of Pakistan still suffers from low productivity, expensive financial support to the farmers, inefficient market structure and improper research. Thus to develop farming sector and to increase the farming efficiency it was recommended to enhance the accessibility of small and marginal farmer to formal agricultural credit. Lo

Farm loan waiver - Reasons, rationale, impacts and alternatives

इमेज
Farm loan waiver.. Why farmers are demanding? Is this demand of farmers beneficial for them? If not then what should be a proper demand? Let’s discuss. Figure no. 1 shows the percentage share debt of cultivator household. It is increasing continuously. In 2004, there were 50% indebted farmer households in whole India (figure no. 2). Figure no.1  Figure no. 2 Current numbers are very bad. About 52 percent of the agricultural households in the country were estimated to be indebted in 2012-13. Andhra Pradesh (92.9 %), Telengana (89.1 %) and Tamil Nadu (82.5 %) are suffering from worst condition. 60% of total loans were institutional which were linked to government (2.1%), co-operative society (14.8%) and banks (42.9%) (situation assessment survey of agricultural households 2012-13). So with this high number, given demand is obvious. Figure no. 3 Now figure no.3 shows that the cost of cultivation and production of major crops in major states in India is continuously incr

From Competitive Federalism to Competitive Sub-Federalism: Cities as Dynamos

इमेज
Competition among ULBs..  CEA wants more competitive urban local body to tackle the problems of urban areas and cities. It sounds good. But will it solve the problems? Let’s see. We should focus more on the root of given problem. The stagnated primary sector and low wages in rural area is the main reason. There are several models on migration (Lewis model of migration, Harris-Todaro model etc.). Logic is very simple. People will move from one sector to another (or from rural to urban) until the wages in both sectors (both areas) get equated. But problem is that the rural wages and agricultural (and wages in primary sector) are increasing but as urban formal sector’s (and tertiary and secondary) wages are also increasing. So they are not being equated by any kind of transformation. We can see the difference between daily wages in agricultural and non-agricultural sector. And that difference is actually expanding informal sector which is responsible for low standard of living

Political stability… It does matter for economics also..

इमेज
Now-a-day, we have strong political stability. But past was little bit unstable. India has witnessed POLITICAL DRAMA in 1980s and even in 1990s. We have experienced several wars also. These things are important not only for political and social conditions but also for economical situation. Let’s see.  I have created a coding for political stability. In India, resignation of prime minister means abolition of council of minister and loksabha. So ideally P.M. should complete full five years. So suppose X person completed his full years as a P.M. then c orresponding years would be coded as 1 (it means government was stable in these years.). Now suppose Y person couldn’t be there as P.M. for 5 years. He ruled (let’s say) only for 2 years then code for corresponding years would be 365*2/365*5 (365*5 are ideal days and 2*365 days were practically stable days.). For emergency, I have given -1 code. One might say that the dictatorship is the most stable (with compare to democracy) and

Inequality: run without your legs

इमेज
कही है रोशनी  तो कही है बस धुआ  कही है छत शीशे का  तो कही है आसमान खुला  And that's inequality. Yes, it’s true that the disparity between rich and poor people is continuously increasing. Recently Oxfam announced the data related to the wealth hold by richest people. According to Oxfam, own 58% of total wealth in India is owned by richest 1%. But why this disparity is increasing continuously? And does it really matter? Let’s have a discussion. First figure shows that the GDP (current US$) (in billion), per capita GDP, government spending and tax revenue is increasing with similar trend. It means tax revenue and government spending (total) is increasing continuously and it's reflecting in the growth of GDP. As GINI coefficient for each year is not available, I am just using the share of top 1% richest people in GDP. We can draw a rough diagram of inequality. Second diagram is showing that the income share of top 1% richest people is increasing after 1