The recent state assembly elections in India provides a deep insight into the evolving political landscape particularly about First Past The Post (FPTP) electoral system. Under the FPTP system, the candidate with the most votes in a constituency wins the election which can fail to translate popular votes into proportional representation, resulting in votes that don't always carry the weight they should. This discrepancy arises due to the winner-takes-all approach, where the candidate with the most votes in a particular constituency win, irrespective of whether they secure an absolute majority or not. As a consequence, a candidate can win a seat by only having a plurality of votes (more than any other single candidate but not necessarily a majority of all votes cast), while the votes cast for other candidates essentially go unrepresented. This leads to a scenario where a significant portion of the population might not see their voices reflected in the government they get, creating what's commonly known as the "wasted vote" phenomenon. In this article, I am trying to understand how this disproportionality between votes and seats exists in latest state election results. Second point I am trying to see it that which party is suffering under this FPTP system and lastly, I am also trying understand the income phenomenon behind these elections results.
Disproportionality Between Votes and Seats
Examining the disproportionality between votes and seats provides critical insights into the effectiveness of representation. Gallagher's index serves as a metric to evaluate this disproportionality, highlighting the extent of the gap between votes received and the corresponding seat allocation.
Higher the Gallagher index , higher the disproportionality. Therefore, the government formed by these parties can be viewed as relatively less representative. The Special Committee on Electoral Reform (a Canadian Parliamentary Committee) suggests that for Canada, the Gallagher Index should be 5 or lower. This Committee also recommends the government take efforts to reduce the Gallagher Index, so that more efficient (i.e., inclusive) representation can be brought into politics. For Indian states, this Gallagher index has been high most of the time. Comparing recent states elections, Telangana and Chhattisgarh show the decline however other states witness the increase in disproportionality,
The question is how this disproportionality goes with wining composition? How are parties’ seats changing along with this disproportionality?
A deeper dive into the relationship between winning compositions and disproportionality unveils a consistent trend. The ratio of seat share to vote share for the leading party consistently surpasses one, while for the second-largest party, it consistently falls below one. This consistent pattern elucidates the inherent disproportionality within the FPTP system.
Seat – Vote concentration
Another way to understand the disproportionality is to see how votes are concentrated and how seats are concentration. If there exists a difference, then it means seats are concentrated to one party whereas votes are distributed among other parties too. (HHI index is formed based on seat share as well as vote share to identify the level of concentration).
Analyzing the concentration of votes against the allocation of seats reveals an intriguing pattern. Seats tend to concentrate more towards specific parties, while votes are distributed among a broader spectrum of political entities. This disparity underscores how certain parties benefit disproportionately from this system, securing a higher number of seats despite a relatively lesser concentration of votes.
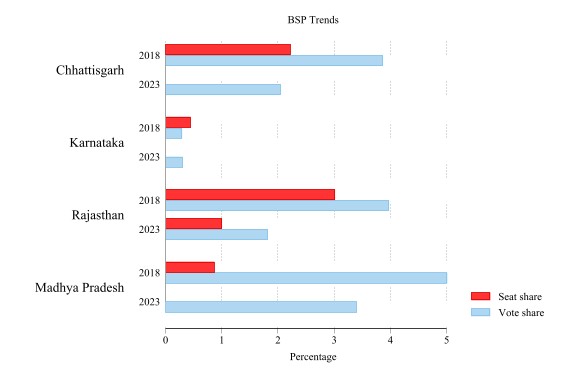
Bahujan Samajwadi Party (BSP)
The important point should be noted that to win an election, geographic concentration of votes is required. If votes of a parties are scattered then that party may capture high vote share but may not be able to convert that votes into seats. In certain areas, there might be a high concentration of support for a particular party or candidate. This concentration can lead to an imbalance between the popular vote share and the actual representation in the legislative body. Consequently, a party might win a substantial number of votes across different constituencies but end up with disproportionately fewer seats due to the uneven distribution of their support. This can be seen for BSP. Despite amassing notable vote shares, these parties struggle to convert these votes into a proportional number of seats. The uneven distribution of support leads to a scenario where significant vote counts across constituencies don't translate into corresponding seats, leaving a segment of voters unrepresented.

Bahujan Samajwadi Party (BSP) is able to capture vote share more than 3-4% but able to get only half of it as a seat share. In 2023 elections, BSP is able to get more than 2% vote shares in Chhattisgarh and more than 3% vote share in Madhya Pradesh but could not win a seat. In Rajasthan, BSP is able to capture 2% vote share but won only 1% seats. This can be interpreted as votes of BSP are actually wasted votes and voters of BSP are not getting representation in the assembly.
Income and Electoral Outcome
Now let's discuss few things about these election results. I am more interested into the Income Dynamics and Electoral Outcome. How congress and BJP did in assembly election and what is an income phenomenon. I used CMIE-CPHS data to get a district level income level and then these districts are divided in quintiles where top quintiles represents the top 20% districts having higher per capita income level and so on.
In the case of Chhattisgarh, a more detailed analysis reveals a compelling trend in the electoral outcomes. Specifically, an examination of districts categorized as affluent, falling within the top quintiles in terms of economic prosperity, unveils a notable electoral shift from the Congress to the BJP. In these economically prosperous districts, the Congress party experienced a loss of seats to the BJP, indicating a distinct pattern influenced by the economic status of these regions.
If we broaden the scope to encompass the top two quintiles, a more comprehensive electoral narrative emerges. Within these segments representing the most economically robust districts, a pronounced trend emerges wherein the BJP significantly wrested a substantial number of seats from the Congress in Chhattisgarh.
Conversely, when we pivot our attention to the bottom quintiles—encompassing districts with comparatively lower economic indicators—an intriguing contrast surfaces. Here, while there's a noticeable transfer of seats from the Congress to the BJP, the magnitude of this shift remains marginal in comparison to the pronounced changes observed within the top quintiles.

In a similar vein, Rajasthan exhibits a parallel phenomenon. Specifically, within the top quintiles representing the more affluent districts, a notable transition of seats from the Congress to the BJP is evident. This trend highlights a consistent pattern where the BJP gains a considerable electoral foothold in economically prosperous regions, shaping the political landscape within these districts.
Expanding the perspective to encompass the top two quintiles unveils a recurrent electoral trend. Once more, within these segments representing the districts with higher economic indicators, the BJP substantially secured a considerable number of seats previously held by the Congress.
In contrast, even within the lower two quintiles denoting districts with relatively lower economic indicators, a transfer of seats from the Congress to the BJP is noticeable. Yet, amidst this shift, clusters of Congress assembly constituencies remain discernible. Despite the BJP making inroads into these economically modest regions, pockets of resilient support for the Congress persist.
Shifting focus to Madhya Pradesh, an intriguing electoral pattern emerges. During the 2018 elections, both the BJP and Congress exhibited commendable performances within the top quintiles, indicating a relatively balanced electoral landscape in economically prosperous districts. However, the dynamics underwent a significant transformation in 2023. Apart from a mere 5-6 constituencies, the BJP swept virtually all seats in the top quintile districts, showcasing a notable consolidation of electoral support in these economically thriving regions.
Expanding the analysis to include the top two quintile districts, a similar trend unfolds. In 2018, both the Congress and BJP maintained a relatively balanced performance within these economically better-off regions. However, the scenario shifted markedly by 2023. The BJP succeeded in clinching the majority of seats, signifying a substantial electoral swing in favor of the BJP within these top strata of economically prosperous districts.

On the contrary, within the bottom two quintiles representing districts with lower economic indicators, while the BJP made inroads by securing seats from the Congress, clusters of constituencies staunchly loyal to the Congress are notably visible. Despite the BJP's gains in these economically modest regions, pockets of unwavering support for the Congress persist

Finally
The intricacies of the recent state assembly elections in India have unveiled multifaceted realities within the First Past The Post (FPTP) electoral system. This system, while determining winners based on constituency majority, generates a significant discrepancy between votes obtained and proportional representation in seats, leading to what's commonly known as the "wasted vote" phenomenon. Analyzing the disproportionality between votes and seats through the Gallagher Index exposes the extent of this imbalance. The Winner-Takes-All approach contributes to the disparity where the leading party often secures a disproportionate number of seats compared to its actual vote concentration. This disproportionality particularly affects parties like the Bahujan Samajwadi Party (BSP), where despite securing notable vote shares, the translation into seats remains insufficient, leaving segments of voters unrepresented.
Moreover, as the analysis delves deeper into the electoral dynamics, economic factors emerge as key determinants in shaping the outcomes across states like Chhattisgarh, Rajasthan, and Madhya Pradesh. A noticeable pattern arises when scrutinizing districts based on economic stratification. Wealthier districts consistently display a substantial shift in seats from the Congress to the BJP, implying a correlation between economic affluence and voting inclinations. However, intriguingly, even within economically modest areas, steadfast pockets of support for the Congress endure despite the BJP's electoral advancements. This prompts the question: why is the Congress experiencing a decline in affluent regions while maintaining a foothold in regions with lower economic indicators?


टिप्पण्या
टिप्पणी पोस्ट करा